Injection molding process flow chart for material and machine steps

Process flow chart at a glance
An injection molding process flow chart tracks the route from raw plastic resin to a finished, inspected molded part. In production, that route is wider than the press cycle. It includes material receiving, resin drying, conveying, dosing, plasticizing, filling, packing, cooling, ejection, trimming, inspection, and the controlled handling of rejects or regrind. This matters because many defects are found at final inspection but start earlier in resin condition, mold temperature, machine settings, or part handling. For a broader view of factory movement, equipment layout, and production routing, see the material flow section.
| Flow stage | Main action | Key control point | Typical output |
|---|---|---|---|
| 1. Resin selection and receiving | Confirm resin grade, color, additives, and lot information | Material identity, lot traceability, contamination control | Released raw material |
| 2. Storage and drying | Store resin correctly and dry hygroscopic materials when required | Drying temperature, drying time, dew point, clean containers | Conditioned resin |
| 3. Conveying and dosing | Move resin to the press and blend colorant, regrind, or additives | Blend ratio, regrind percentage, hopper level | Consistent feed stream |
| 4. Plasticizing | Melt and homogenize resin in the barrel | Barrel profile, screw speed, back pressure, shot size | Measured melt shot |
| 5. Mold close and clamp | Close the mold and apply clamping force | Clamp tonnage, mold protection, platen alignment | Closed mold ready for injection |
| 6. Fill | Inject molten plastic into the cavity | Injection speed, pressure limit, transfer position | Mostly filled cavity |
| 7. Pack and hold | Apply pressure to compensate for shrinkage while the gate remains effective | Hold pressure, hold time, gate freeze behavior | Dimensionally supported part |
| 8. Cool and recover | Cool the part while the screw prepares the next shot | Mold temperature, cooling time, cushion, recovery time | Solidified part and next shot ready |
| 9. Mold open and eject | Open the mold and remove the part | Ejector stroke, robot timing, part release | Molded part outside the tool |
| 10. Trim, inspect, pack, or rework | Remove runners, inspect quality, pack approved parts, segregate nonconforming parts | Critical dimensions, appearance, weight, documentation | Finished goods or controlled scrap |
Why the chart should include material flow, not only machine motion
Many simplified diagrams start with mold closing and end with ejection. That is acceptable when the purpose is to describe only the press cycle, but it is incomplete for production control. A molded part is affected before pellets reach the screw. Moisture, dust, mixed lots, unstable colorant dosing, or uncontrolled regrind can change melt behavior before the injection unit starts its work.
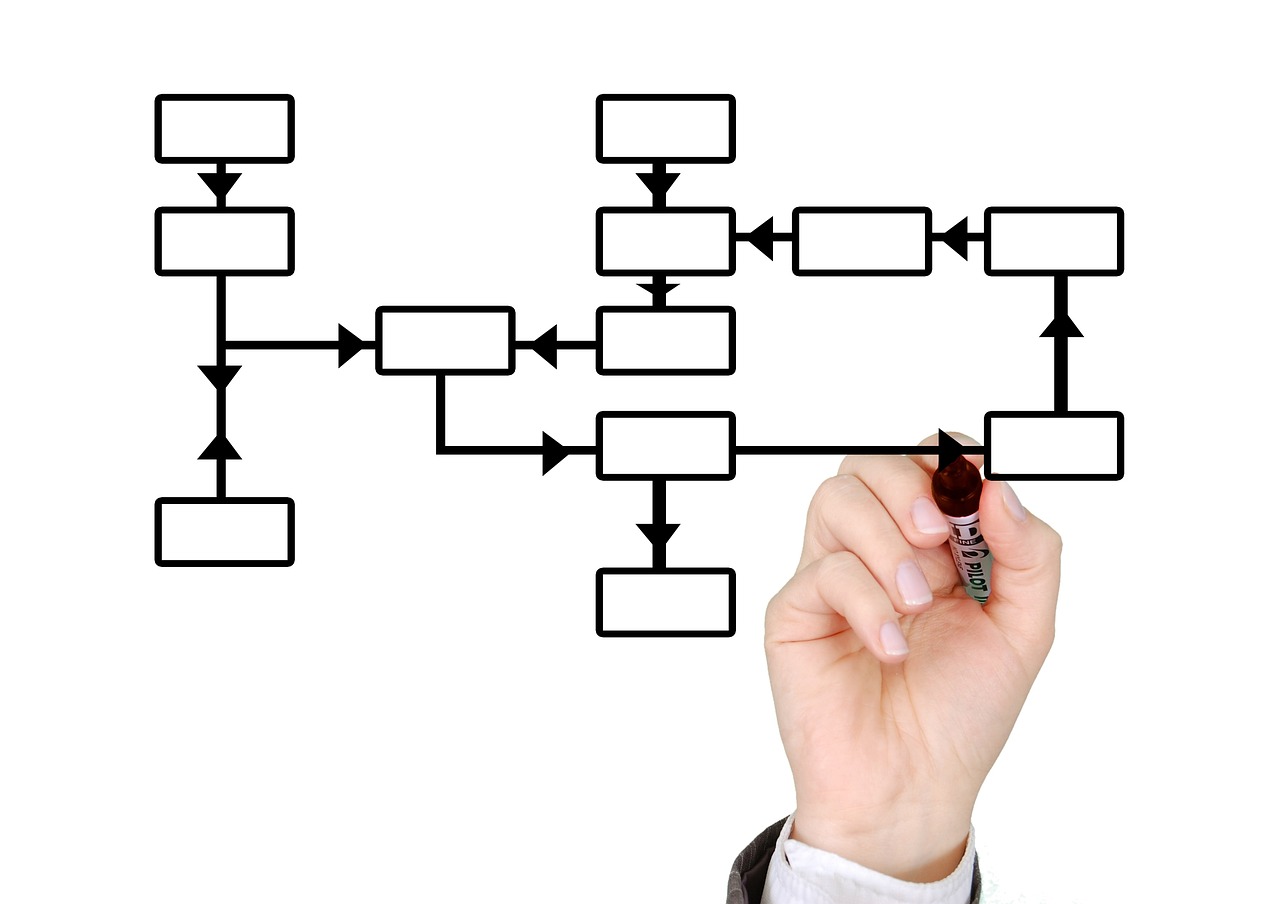
The material side of the chart should show where resin is approved, where it is dried, how it is transferred, and whether secondary materials enter the feed stream. Hygroscopic resins, such as nylon, polycarbonate, PET, and some engineering plastics, commonly require drying based on supplier recommendations. Non-hygroscopic resins may still need protection from surface moisture and contamination. The chart should not show one universal drying condition because drying temperature and time depend on the polymer grade, supplier data sheet, pellet condition, and dryer performance.
A useful shop-floor flow chart also identifies decision points. If resin is outside the drying specification, for example, the flow should stop or loop back to conditioning instead of continuing to molding. If regrind is used, the chart should show who approves the percentage, how it is blended, and where nonconforming material is separated. These details keep the chart from becoming a decorative diagram and make it a working production document.
How one injection molding cycle works
The machine cycle is the central part of the flow chart. Public technical references commonly describe it as a repeated sequence of plasticizing, injection or filling, packing and holding, cooling, mold opening, and ejection. Some diagrams combine plasticizing with cooling because screw recovery usually happens while the part cools in the closed mold. Others separate them because different machine settings control each stage.
Mold close and clamp
The cycle begins when the mold closes and the press builds clamping force. The clamp must resist cavity pressure during filling and packing. Too little clamp force can allow flash at the parting line, while excessive force can increase wear on the mold and machine. A practical flow chart should show mold protection before full clamp force is applied, especially when inserts, slides, lifters, or delicate shutoffs are present.
Plasticizing and shot preparation
During plasticizing, the screw rotates and conveys pellets forward through heated barrel zones. The resin melts through a combination of external heat and shear. The machine meters a shot in front of the screw, while the process technician controls variables such as barrel temperature, screw speed, back pressure, decompression, and shot size. In the flow chart, this stage links material condition to melt consistency.
Filling
Filling begins when the screw moves forward and pushes molten plastic through the nozzle, sprue, runner, gate, and cavity. The goal is not simply to force plastic into the mold. The cavity must fill in a controlled way that avoids burns, jetting, hesitation, weld-line weakness, short shots, and excessive shear. The transfer point from fill to pack is usually one of the most important process settings because it determines when velocity control changes to pressure control.
Packing and holding
After the cavity is mostly filled, packing and holding pressure help compensate for material shrinkage as the polymer cools. This stage strongly affects part weight, sink marks, voids, dimensional stability, and molded-in stress. The gate remains the limiting feature. Once the gate freezes, additional hold pressure no longer feeds meaningful material into the cavity. For that reason, many process studies use part-weight response to help understand effective hold time.
Cooling and screw recovery
Cooling often dominates the cycle because the molded part must become rigid enough to eject without deformation. Cooling begins during filling, but the dedicated cooling stage is normally counted after packing or holding. At the same time, the screw typically recovers the next shot. If recovery time is longer than cooling time, the machine may wait for the screw. If cooling time is too short, parts may warp, stick, dent, or change dimensions after ejection.
Mold opening and ejection
When cooling is complete, the clamp opens and ejector pins, sleeves, stripper plates, air assist, or robotics remove the part. The chart should include part-removal confirmation when automation is used. If a part remains in the cavity, the next close can damage the mold. For manual operations, the flow should also show safe access rules and any required confirmation before the next automatic or semi-automatic cycle.
Quality checks to place along the flow
Inspection is often shown at the end of a process chart, but quality control is more effective when checks are placed where variation enters the process. A part can pass appearance inspection and still carry hidden risk if material drying, shot cushion, mold temperature, or hold pressure has drifted. The flow chart should make those risk points visible.
| Control point | What to check | Why it matters |
|---|---|---|
| Material release | Resin grade, lot, color, additive package, certificate or internal approval | Prevents wrong-material production |
| Drying | Dryer setting, residence time, dew point where monitored, hopper condition | Reduces moisture-related splay, brittleness, or processing instability |
| Startup approval | First-piece dimensions, appearance, part weight, machine setup sheet | Confirms the process before full production |
| During production | Cushion, cycle time, temperatures, pressures, rejects, alarms | Detects drift before large quantities are affected |
| Post-molding | Gate vestige, flash, sink, short shot, warpage, contamination, packaging condition | Protects customer-facing quality |
Part weight is a practical indicator because it responds to filling, packing, material density, and gate freeze behavior. It should not replace dimensional inspection, but it can provide an early warning when the process moves away from the approved window. For critical parts, the chart may also include destructive testing, functional testing, or statistical process control. These checks should be based on the part drawing, customer requirements, and the internal quality plan.
Using the flow chart to trace common defects
A useful injection molding process flow chart supports troubleshooting. Instead of changing settings at random, engineers and technicians can follow the process backward from the defect to the most likely stage. See also: automation and controls.
- Short shots often point to filling limits, restricted gates or vents, low melt temperature, insufficient shot size, poor material feed, or inadequate injection speed and pressure capability.
- Flash can relate to excessive injection or pack pressure, low clamp force, mold wear, parting-line damage, or poor mold alignment.
- Sink marks and voids usually require review of packing pressure, hold time, gate size, wall thickness, material shrinkage, and cooling balance.
- Warping can originate in uneven cooling, unbalanced filling, poor part design, excessive molded-in stress, or ejection before the part is stable.
- Splay or silver streaks may come from moisture, contamination, trapped air, thermal degradation, or excessive shear.
- Burn marks can indicate trapped gas, poor venting, excessive injection speed, or degradation from temperature and residence time.
This defect-based view gives the chart more value than a simple step diagram. It connects each visual or dimensional problem to a location in the process and helps separate material problems from tooling problems and machine-setting problems. In practice, recurring defects often require more than one correction, so the chart should support structured checks rather than one-setting-at-a-time guesswork without evidence.
Safety and workflow limits that belong in the chart
Injection molding involves high clamp force, hot plastic, hydraulic or electric motion, stored energy, moving platens, ejectors, robots, and auxiliary equipment. Safety steps should not sit outside the production flow. They are part of the flow because unsafe access, bypassed guards, or unclear maintenance states can interrupt production and create serious injury risk.
OSHA’s public machine-guarding guidance for horizontal injection molding machines emphasizes operator gates, interlocks, guarding, employee training, and lockout/tagout for servicing and maintenance. ISO 20430:2020 identifies essential safety requirements for injection molding machines and information for safe use. A plant-level process chart should not replace standards, risk assessments, equipment manuals, or legal requirements. It should, however, show where guards must be closed, where access is prohibited during automatic operation, and when maintenance or mold work requires controlled energy isolation.
The safety layer of the chart is especially important during mold change, purge, jam clearing, startup, and troubleshooting. These are the moments when people may leave normal automatic production and interact directly with the machine. A clear flow should distinguish normal cycling from setup mode, manual intervention, maintenance, and lockout/tagout conditions. That distinction helps operators understand when production steps stop and safety procedures take priority.
How to design a practical flow chart for a molding cell
A good chart is specific enough to guide work but not so crowded that operators ignore it. Start with the physical path of material: resin storage, drying, conveying, press, molded part handling, inspection, packaging, and scrap control. Then add the machine cycle inside the press: clamp, plasticize, fill, pack, cool, open, eject, and repeat. Finally, mark decision points where the flow can stop, loop back, or require approval.
- Define the chart boundary. Decide whether the chart covers one press cycle, one molding cell, or the full path from resin receiving to packed goods.
- Use verbs for each step. Examples include dry resin, convey material, close mold, inject melt, hold pressure, cool part, eject part, inspect part, and pack product.
- Add measurable controls. Include the setting or record that proves the step is under control, such as drying time, shot size, cushion, cycle time, mold temperature, part weight, or inspection result.
- Show loops and rejects. Nonconforming parts should move to a controlled area. Regrind should return only through an approved route, not informally back to the hopper.
- Separate normal operation from intervention. Startup, mold change, jam clearing, and maintenance need their own safety and approval logic.
- Review the chart at the machine. A chart made only in an office may miss the actual movement of bins, dryers, robots, conveyors, sprue pickers, and operators.
The finished chart can be used for operator training, process audits, production planning, troubleshooting, and improvement projects. It is also useful when comparing manual part removal with robotics, central conveying with machine-side loading, or cold-runner scrap handling with hot-runner production. In each case, the chart shows where time, handling, risk, and quality variation enter the system.
Frequently asked questions
What are the main steps in an injection molding process flow chart?
The main steps are resin selection, storage and drying, conveying and dosing, plasticizing, mold closing and clamping, filling, packing and holding, cooling, mold opening, ejection, trimming, inspection, and packaging. A simplified machine-only chart may start at mold close and end at ejection, but a production chart should include material preparation and quality control.
What is the difference between filling and packing?
Filling moves molten plastic into the mold cavity, usually under velocity control. Packing and holding apply pressure after the cavity is mostly filled to compensate for shrinkage while the gate remains able to transmit pressure. Filling shapes the initial flow pattern; packing strongly affects weight, sink, voids, and dimensions.
Why is cooling so important in the flow chart?
Cooling is critical because the part must become rigid enough for ejection and stable enough to hold its intended shape. Poor cooling balance can increase warpage, cycle time, sticking, or post-mold dimensional change. The cooling stage also overlaps with screw recovery, so it affects both part quality and machine productivity.
Should regrind be shown in the process flow?
Yes, if regrind is used. The chart should show how runners, sprues, or rejected parts are separated, ground, stored, approved, blended, and returned to production. It should also show limits on regrind percentage and contamination control. Uncontrolled regrind can create color, strength, moisture, and processing variation.
Can one flow chart apply to every molded part?
A general chart can explain the common injection molding sequence, but production charts should be adapted to each part family, resin, mold, machine, and quality requirement. Insert molding, overmolding, hot-runner tools, cleanroom molding, automation, and engineering resins may add steps that do not appear in a basic diagram.